/projects/twitter-coronavirus-mapreduce/
Coronavirus Twitter Analysis
How do hashtags spread across languages and countries during a pandemic?
- Python
- shell scripting
- MapReduce
- POSIX
- large-scale data processing
- visualization
Overview
A custom MapReduce pipeline built to study how COVID-related hashtags spread geographically and linguistically, run directly over roughly 1.1 billion geotagged tweets from 2020 without a distributed-computing framework.
Input
- 365 daily compressed tweet archives
- ~1.1 billion geotagged tweets
Processing
- Parallel POSIX mapper streams each archive
- Python reducer combines per-day counts
Output
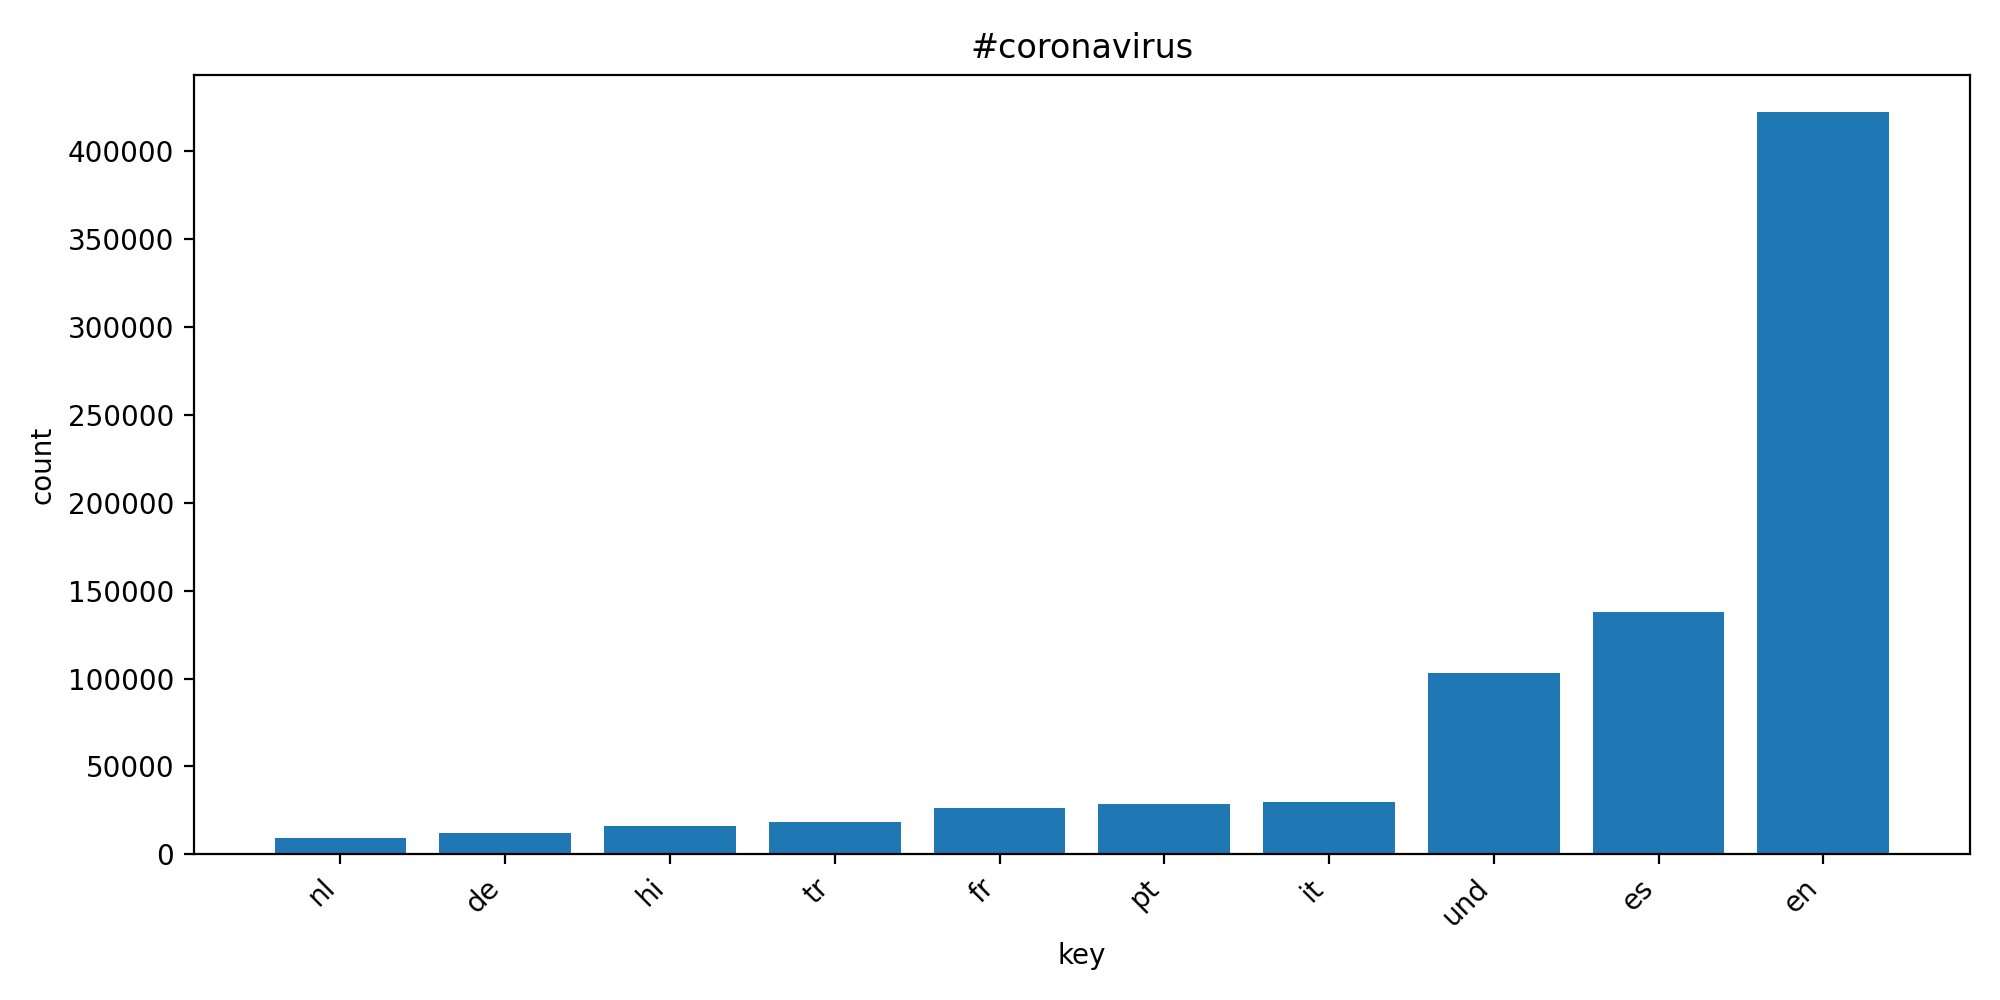
- Yearly hashtag totals by language and country
Problem
The 2020 Twitter archive is far too large to load into memory or process with ordinary scripts, and decompressing a full year of daily archives to disk before processing would have been slow and disk-prohibitive. The task was to extract hashtag-by-language-by-country trends from that volume of data on ordinary hardware.
Approach
The pipeline follows a classic map/reduce split, implemented from scratch rather than through a managed framework: one mapper process per day of data, launched as parallel POSIX background processes, each streaming its compressed archive directly rather than decompressing it to disk first. Python reducers then aggregate the per-day outputs into yearly hashtag counts, broken down by language and country.
Technical Implementation
Mapper and reducer logic is plain Python and shell, orchestrated with `nohup`-style background process management to run many days of data in parallel and to survive terminal disconnects on long jobs. Streaming compressed archives directly (rather than gunzipping to disk first) was the key constraint that shaped the whole pipeline, since a year of tweet archives decompressed would not fit comfortably on disk.
Evaluation & Results
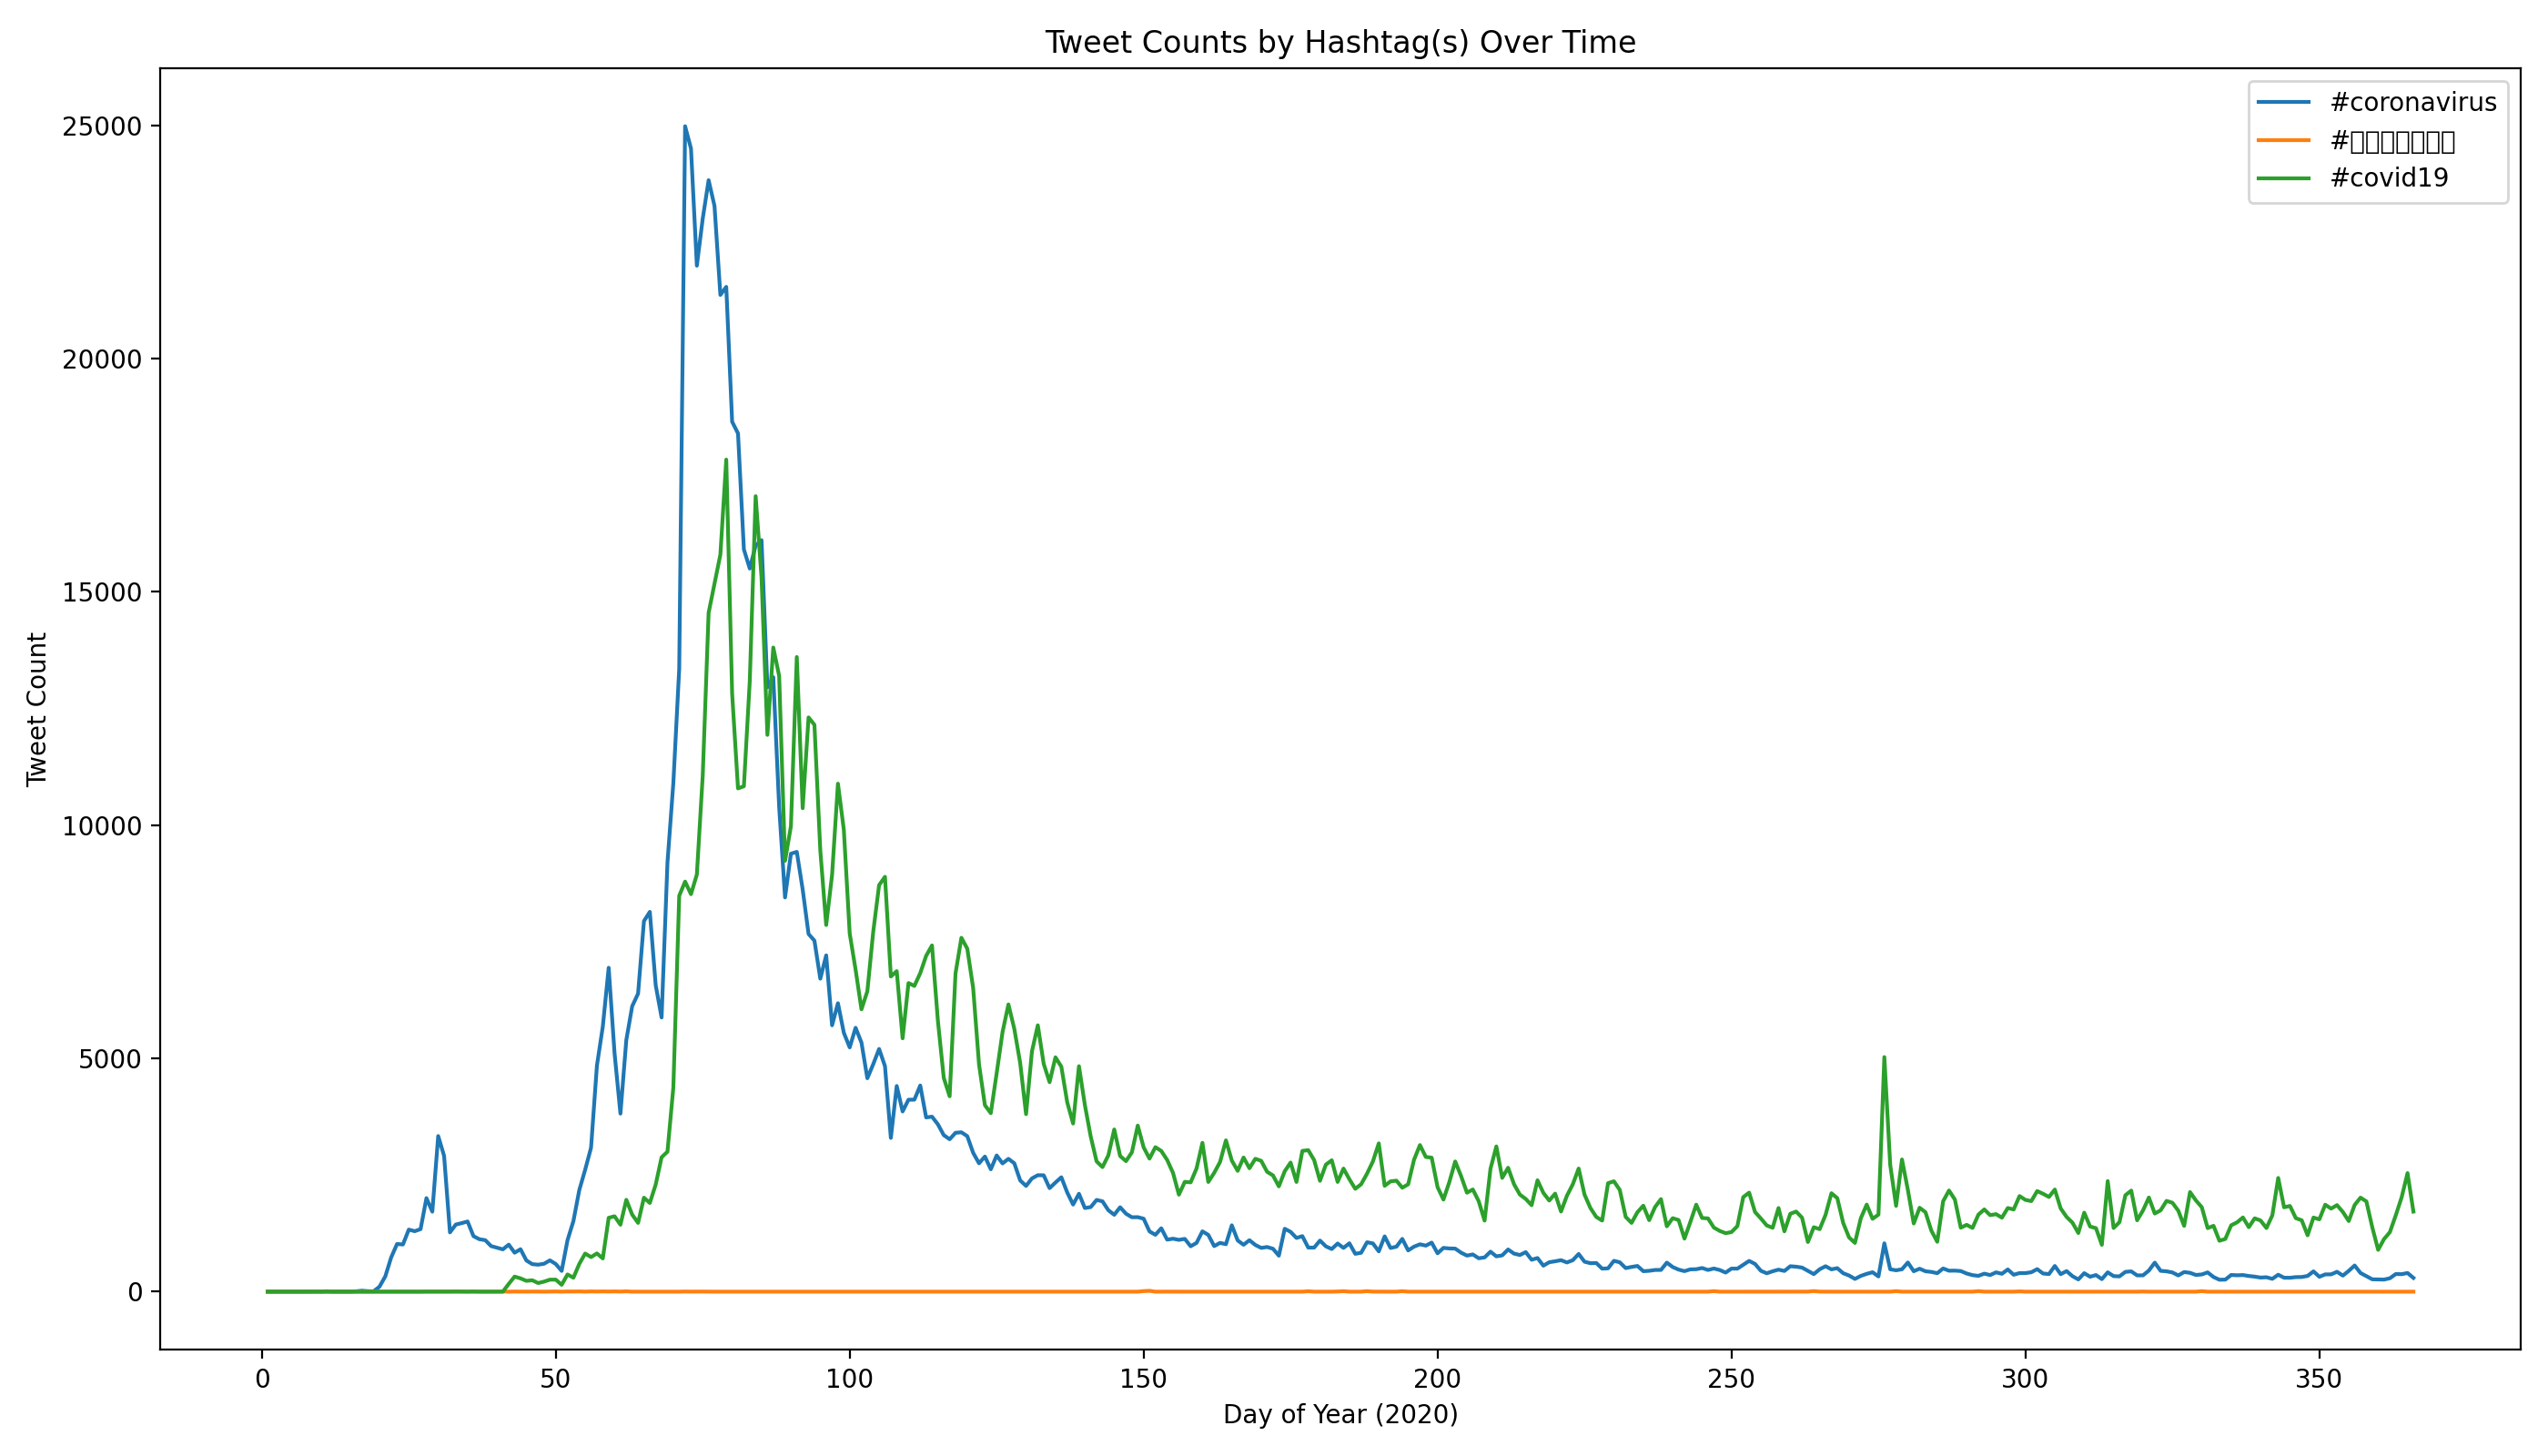
The pipeline successfully aggregated hashtag distributions across languages and countries for the full ~1.1 billion tweet dataset and produced the trend visualizations shown above, tracking how coronavirus-related hashtags rose and spread over the course of 2020 by language.
What I Learned
At this scale, the systems constraints (disk space, process parallelism, streaming vs. decompressing) determine the design as much as the analysis question does. I also used this dataset as the starting point for a follow-up project on query performance — see twitter_postgres_indexes below, which works with a ~31 million row subset loaded into PostgreSQL.